Tools and techniques in climate changes studies

Negative consequences of climate change are often conceived as too abstract and only of consequence for others in distant places. It is believed, however, that with use of geographical information systems (GIS) and other visual methodologies, climate change effects become real and easier to relate to one owns life.
An intensive course on “Tools and Techniques in Climate Change Studies” (June 15-19 2015), hosted by the Department of Geography (NTNU) in Trondheim, and financed by Climres, Nordress and the Department, addressed critical issues relating to how GIS and other visual tools and techniques are relevant for climate change adaptation and mitigation.
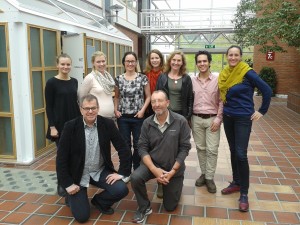
The course consisted of lectures, lab-exercises, software demonstrations, and a paper presentation session where the participants presented their perspectives on how to apply various GIS and visual methodologies in their own projects. The course instructors – Professor Stephen R. J. Sheppard from the University of British Columbia in Canada and Professor and Climres-researcher Jan Ketil Rød – provided the 12 course attendees with knowledge on how to use GIS and geovisualization in mapping exposure to environmental hazards including using climate change visualization for future visioning of local climate change.
A set of lab-exercises was one of the highlights of the course. The exercises were designed to provide the participants with case examples where GIS tools can facilitate climate change adaptation and mitigation actions. The participants were thus able to use GIS tools for visual impact analysis and measure solar irradiance (terrain representation and 3D derivatives). There was also the opportunity to try out GIS-based multiple-criteria decision analysis and to use GIS tools for integrated hazard mapping.
Parallel to the course, a workshop on “How to use (geo) visualization to assist participatory methodologies?” was organized. The workshop covered issues such as how visualization tools can be used when interviewing people about their preparedness for a possible intensification of hazard events due to climate change, or how to use feedbacks from relevant stakeholders and/or the general public to take decisions on how to further develop web-based visualization tools.
